The Best Time to Visit Sham Shui Po
Sham Shui Po is a street district, so the weather decides how much of it you actually get to walk. The answer to "when should I go?" is a decision, not a weather report: pick a dry, bright month and you can cover Apliu Street, Fuk Wing Street and the fabric blocks on foot in a single day; land in the middle of the wet season and the same day becomes a fight with an umbrella. This page turns the Hong Kong Observatory's published climate figures into that decision.
Every number below is from the Hong Kong Observatory's 1991–2020 monthly meteorological normals for Hong Kong, except where a passage is explicitly attributed to the Observatory's separate Climate of Hong Kong page, which describes the 1961–1990 period. The two periods are different, and they are labelled separately wherever they appear.
The short answer
The Observatory's own summary of the year-end is the safest thing to quote: November and December bring "pleasant breezes, plenty of sunshine and comfortable temperatures. Many people regard these as the best months of the year" (Hong Kong Observatory, Climate of Hong Kong, 1961–1990 page). Those two months also carry the lowest mean rainfall of the year on the 1991–2020 normals — 39.3 mm in November and 28.8 mm in December, against a June figure of 491.5 mm.
The trade-offs to weigh instead of hunting for a single "best" month:
- January to early March — the coolest stretch of the year. Mean daily minimum drops to 14.6 °C in January and mean rainfall is only 33.2 mm, but the Observatory records February and March as the two dullest months of the year for bright sunshine (101.7 and 100.0 hours).
- May to September — the wet half of the year, carrying about 80 percent of the annual rain per the Observatory, with high humidity and the year's tropical-cyclone exposure.
- September — the Observatory's stated peak month for tropical-cyclone influence, with hot, still, humid conditions either side of it.
- October — the sunniest month of the year on the 1991–2020 normals (197.8 hours) and drier than any summer month (120.3 mm), but still inside the Observatory's May–November window for gales.
Month by month
Temperatures are in degrees Celsius; rainfall is the mean monthly total in millimetres; "cyclone days" is the mean number of days with a tropical cyclone warning signal of No. 1 or higher. All figures: Hong Kong Observatory, 1991–2020 normals.
| Month | Mean daily max | Mean | Mean daily min | Mean rainfall | Cyclone days | What it means for a market day |
|---|---|---|---|---|---|---|
| January | 18.7 | 16.5 | 14.6 | 33.2 mm | none recorded | Cool and mostly dry; the driest walking weather of the winter, with a short-sleeve layer needed by afternoon. |
| February | 19.4 | 17.1 | 15.3 | 38.9 mm | none recorded | Driest month after December, but the second-dullest for sunshine — flat light for photography. |
| March | 21.9 | 19.5 | 17.6 | 75.3 mm | none recorded | Dullest month of the year for sunshine (100.0 hours); rain starts to build. |
| April | 25.6 | 23.0 | 21.1 | 153.0 mm | 0.20 | Warm and comfortable, but rainfall roughly doubles month on month. |
| May | 28.8 | 26.3 | 24.5 | 290.6 mm | 0.27 | Wet season opens; humidity climbs to 83% and street stalls start losing days to rain. |
| June | 30.7 | 28.3 | 26.5 | 491.5 mm | 2.00 | Wettest month of the year; plan indoor stops and expect short, heavy downpours. |
| July | 31.6 | 28.9 | 26.9 | 385.8 mm | 3.13 | Hottest month, and the second-sunniest (197.3 hours) when it is not raining. |
| August | 31.3 | 28.7 | 26.7 | 453.2 mm | 4.17 | Highest average count of cyclone-warning days of any month; market days are the least reliable. |
| September | 30.5 | 27.9 | 26.1 | 321.4 mm | 3.83 | Still hot and humid; the Observatory's peak month for tropical-cyclone influence. |
| October | 28.1 | 25.7 | 23.9 | 120.3 mm | 1.70 | Sunniest month of the year (197.8 hours) and much drier — the best shoulder month for walking. |
| November | 24.5 | 22.2 | 20.3 | 39.3 mm | 0.57 | Dry, comfortable and bright; the Observatory's own pick, with December. |
| December | 20.4 | 18.2 | 16.2 | 28.8 mm | none recorded | Driest month of the year (28.8 mm) with 161.6 hours of sunshine; a layer for the evening. |
The year averages 2431.2 mm of rain across the 1991–2020 normals.
The wet season, honestly
The Observatory is blunt about where the rain sits: "About 80 percent of the rain falls between May and September." June is the wettest month on the 1991–2020 normals at a mean monthly total of 491.5 mm — more than a third of the entire annual total in one month. Mean relative humidity runs 81–83% from May to August, so even the dry hours in that window feel heavy.
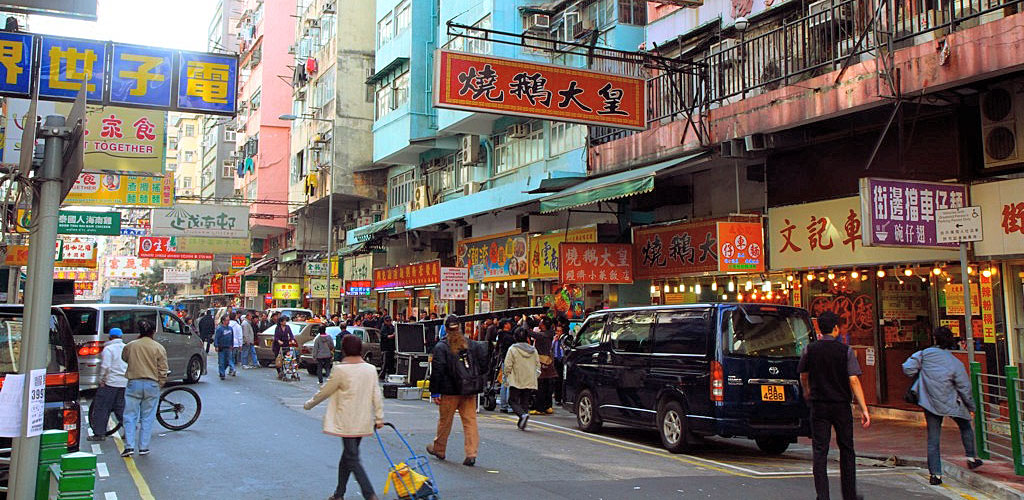
What that does to a day of street markets: the district's best-known shopping is outdoors. Apliu Street, the fabric blocks and the street stalls on Fuk Wing Street and Yu Chau Street have no roof over them, and a June or August downpour does not just interrupt a walk — it empties the pavement. If your dates are fixed in that window, build the day around two or three indoor anchors and treat the street stretches as the gaps between them.
Typhoons: what the normals actually say
Two statements from the Observatory are worth keeping separate from the folklore. First, the peak: "September is the month during which Hong Kong is most likely to be affected by tropical cyclones, although gales are not unusual at any time between May and November." Second, the frequency: the 1991–2020 normals record a mean of 15.87 days a year with a tropical cyclone warning signal of No. 1 or higher. Broken down by month, August averages 4.17 such days, July 3.13 and September 3.83; April and May average 0.20 and 0.27; and January to March and December record none in the normals.
Note what that does and does not tell you. The Observatory's wording is a window, not a fixed season, and a warning-signal day is a day on which a signal was in force — not a day the district shut down. When a signal is hoisted, follow the Observatory's own warnings rather than any district-level rule, and use the MTR for the part of the day you still need to travel: the system is underground or covered for most of the trip into Sham Shui Po station.
The sunniest and the dullest months
For photography the sunshine figures matter more than the temperature figures. October (197.8 hours) and July (197.3 hours) lead the year; February (101.7 hours) and March (100.0 hours) trail it. So the flat, grey-light months are late winter and early spring, and the two brightest months are a wet-season month and the start of autumn. If you are planning the trip around photographing the district's street life and signage, October gives you the best combination of bright light and low rainfall; July gives you the light, but in the middle of the year's heaviest rain.
What to do when it rains
The district has a genuine indoor layer, and the Hong Kong Tourism Board's own Sham Shui Po listing names the district's streets and venues. For a washed-out day, the large covered stops are Golden Computer Arcade and Golden Computer Centre and Dragon Centre — both multi-floor indoor malls in the district. The computer-shop stretch on Fuk Wa Street and the toy shops of Fuk Wing Street are worth the trip in any weather when the showers pause, and the Nam Cheong Street and Ki Lung Street area sits closest to the station.
Opening hours at these malls are set by the individual operators, so check before you travel rather than assuming a fixed centre-wide schedule. Getting there is the easy part: the MTR's Tsuen Wan Line runs the district's main station, with trains roughly every 2.1 minutes at weekday morning and evening peak, every 3.5–5 minutes off-peak, every 2.2–4.2 minutes on Saturdays and every 3.1–5 minutes on Sundays and public holidays (MTR, official service information). The transportation hub guide covers how that connects to the rest of the network, and Apliu Street is the natural first stop once the rain eases.
When to come for what is on
Climate decides comfort; the calendar decides the date. Sham Shui Po runs year-round street activity, but the district's festivals, market events and seasonal programmes are listed month by month on the site's events calendar, which is the place to check what is actually on during the weeks you are considering — including the current month on the October 2026 listings. For a food-led visit, pair the driest months with the food tour guide; for an evening plan, the night market guide covers what stays open after dark.
Packing list that follows from the numbers
- Rain shell, May to September — 80 percent of the year's rain falls in those five months, and June alone averages 491.5 mm.
- A light layer for January and February — mean daily minimum 14.6 °C and 15.3 °C, and the damp cold is the part visitors underestimate.
- Sun protection for July to October — those four months include the two sunniest of the year (197.3 and 197.8 hours).
- An indoor plan — Golden Computer Arcade, Golden Computer Centre or Dragon Centre, held in reserve for the June–September washouts.
Frequently asked questions
What is the best month to visit Sham Shui Po?
The Hong Kong Observatory says of November and December: "pleasant breezes, plenty of sunshine and comfortable temperatures. Many people regard these as the best months of the year." On the 1991–2020 normals they are also the two driest months, at 39.3 mm and 28.8 mm of mean rainfall.
Does it rain a lot in Sham Shui Po in June?
June is the wettest month of the year on the 1991–2020 normals, with a mean monthly rainfall of 491.5 mm — the highest of the twelve months and more than a third of the annual total of 2431.2 mm.
When is typhoon season in Hong Kong?
The Observatory's wording is that gales "are not unusual at any time between May and November", with September the month most likely to be affected by tropical cyclones. The 1991–2020 normals average 15.87 days a year with a tropical cyclone warning signal of No. 1 or higher, peaking at 4.17 days in August.
Is Sham Shui Po worth visiting in summer?
Yes, with a plan. July and August hold the year's brightest sunshine after October (197.3 and 182.1 hours), but they also average 385.8 mm and 453.2 mm of rain and 3.13 and 4.17 cyclone-warning days respectively, so build the day around the district's indoor malls and take the street stretches between showers.
Climate figures: Hong Kong Observatory, monthly meteorological normals for Hong Kong 1991–2020, and the Observatory's Climate of Hong Kong page (1961–1990) for quoted statements. Additional travel information: MTR service information and the Hong Kong Tourism Board's Sham Shui Po neighbourhood listing.